Monday, December 17, 2012

Energy Installment

Energy Installment:
Energy Use:
-in total:13461000000 kWh
-per capita: 1,392 kWh

-The graph below shows energy use per capita from 1990 to 2012. Between 1990 and 2000 the energy use was much lower than the energy use between 2001 and 2012.
Historical Data Chart


Energy Distribution:
-Residential: 44%
-Commercial:10%
-Industrial: 30%
-Public: 16%


Where does the energy come from?
-82% from fossil fuels
        -imported gas and oil
-14% from hydroelectric
-2% from wind
-2% from solar/other

Hydroelectric:

-The Dominican Republic has been trying to rely less on important oils and gas to move towards hydroelectric power. With being surrounded by water, hydroelectric power is easily accessible as well as efficient.
-there are currently 20 hydroelectric plants
-the plan is to boost hydroelectric power to 25% by 2020
-the graph below shows hydroelectric power from 1990 to 2012. As shown hydroelectric power has been becoming increasingly popular over the period of time
Historical Data Chart


Wind:
-only 2% of the power is wind
-the plan is to increase this to about 7% by 2020
-the Dominican Republic is currently working on a project that will spend around $100 million on installing wind farms. There will be 19 wind towers built and overall they will contribute 33 megawatts to the national electricity. That 33 megawatts will save 200,000 barrels of oil a year.
-the Inter-American Development Bank loaned $78.3 million for two new wind projects

Solar/other:
-about 1.5% is used on solar power
-with the Dominican Republic being located so close to the equator solar power would be very efficient. The disadvantage to solar power is the cost. With many people living below poverty line, people cannot afford to install solar panels.
-steam and gas turbines are sometimes used
           -expensive and not efficient


Energy Policy:
-National Energy Plan
           -because of high demand of fossil fuels, high oil prices and the reliance upon other countries
           -Dominican Republic started plan to become more self-sufficient and start developing and using renewable energy sources versus using fossil fuels. This plan was started in 2004 and has goals to meet by 2020. These goals for example are to increase hydroelectric power to 25% and wind to 7% by 2020.

-Indicative Plan of Electricity Generation
         -to increase the use of renewable energy
         -the National Energy Commission is promoting the use of renewable energy by creating tax incentives for those who use renewable energy
-in the graph shown below it is the fossil fuel consumption from 2000 to 2012. As shown the fossil fuel consumption has decreased, proving the energy policies to be successful.
Historical Data Chart

Sustainable Sources of Energy:
-with trying to convert to self-sufficiency, the Dominican Republic's main sustainable source of energy is hydroelectric power. With being located on the water it is extremely sustainable to build turbines for tidal power as well as dams in the rivers.

Recommendations:
-increase hydroelectric power
-increase solar power
-increase wind power

-the Dominican Republic should increase the use of hydropower by building turbines to capture the energy of the waves. They can do this using tidal power. In addition to using tidal power, the Dominican Republic should build solar panels. They should ask for a loan to build the panels, because given that they are located so close to the equator this will be a successful project. Lastly they should continue to try to increase wind power by building wind turbines off the coast. By doing this it will not take up valuable farming space and will also be able to capture the sea wind.

Friday, November 16, 2012

Population

Population Growth Over Time:
The Dominican Republic has had a steady population growth over time
        -in 1940 there were about 3 million people
        - the population growth rate was about 2.9%
        -in 1950 there was a spike in growth rate to 3.6% due to a positive economy 
                 -because of this sudden peak the government began implementing family planning
        -late 1970's early 1980's the growth rate declined to 2.5% due to the successful implementing of family                planning
       -the population growth continued to grow and by the 1990's the population was 7 million
Current Population: 
       -the population has grown to 10,225,482 as of July 2012
       - the growth rate as of July 2012 is 1.305%
                  -ranked 90 for population growth rate among other countries
       -although the growth rate has declined because more people are staying in school to become educated, the population is still growing every year 
       -ranked 85 in the world for current population


Dominican Republic Distribution:
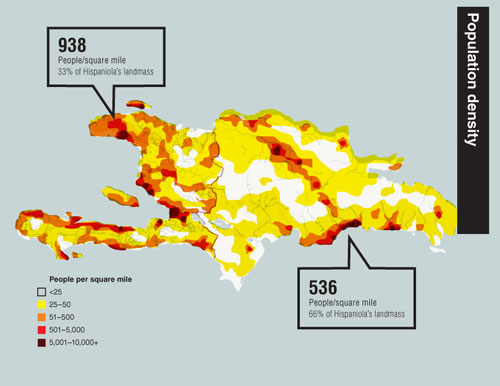
      -most people live in the urban areas
                  -7,074,135 which is about 69.2%
      -a smaller portion of the population lives in the rural areas
                  -3,151,347 which is about 30.8%
      -many people live in coastal cities for the job opportunities with tourism and large companies such as the sugar industry in the city and also for clean water, sewage disposal and electricity
                  -for example Santo Domingo is one of the largest cities
      -many people also live in urban areas near big rivers
                 -for example the Rio Yaque del Sur river


Fertility Rate:
     -2.41 children born/woman
     -ranked 90 for fertility rate compared to other countries in the world 
Graph:
     -the peak in the graph in the 1950's was because of a good economy 
     -the dip in the graph was when family planning was implemented in the late 1970's

Death Rate:
   -4.41 deaths/1,000 people
           -ranked 200 in death rate compared to other countries
  -the death rate has decreased since 2000

Life expectancy:
   -77.44 years on average for the entire population
           -male: 75.28 years
           -female:79.69 years
           -ranked 64 in the world for life expectancy among other countries
Chart:
  -the death rate peaked between 2003 and 2005 because all the people who were born during the peak of the 1950's were dying 

           
Country
2000
2001
2002
2003
2004
2005
2006
2007
2008
2009
2010
2011
2012
Dominican Republic
4.72
4.7
4.68
6.88
7.1
7.35
5.73
5.32
5.3
5.28
4.3
4.35
4.41


Growth Rate:
  - the growth rate as of July 2012 is 1.305%
                  -ranked 90 for population growth rate among other countries
  -the growth rate has decreased
                 -due to education and schooling becoming more popular women are waiting longer to have children 
                -with implementing family planning still in effect the growth rate has been controlled so there are only minor decreases or increases

Country
2000
2001
2002
2003
2004
2005
2006
2007
2008
2009
2010
2011
2012
Dominican Republic
1.64
1.63
1.61
1.36
1.33
1.29
1.47
1.5
1.5
1.49
1.36
1.33
1.31


Doubling Time:
 -53.44 years
     -this has remained a constant for the past 20 years give or take a few minor fluctuations in increasing or decreasing growth


Demographic Transition:
 -currently in stage 2 with a high birth rate and a declining death rate
 -with birth rates slowly declining the country is looking at many more years until they move toward the beginning of stage 3
 -still high birth rates because not many people go to school and family planning is an important issue
                -the government is trying to encourage more people to stay in school and implement family planning however it will take time to move through demographic transition
 -there are still reasonably high death rates compared to other countries because of the lack of clean water, sewage disposal and electricity in many areas of the country


Age Structure: (as of July 2011)
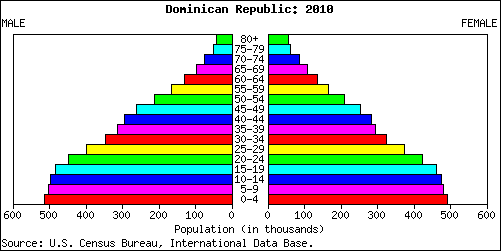
 -0-14 years old: 29% (male 1,487,058/female 1,435,903)
 -15-64 years old: 64.3% (male 3,311,791/ female 3,178,705)
 -65 years and older: 6.7% (male 311,811/female 363,330)

Current Structure:
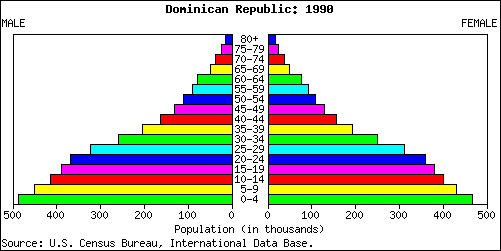
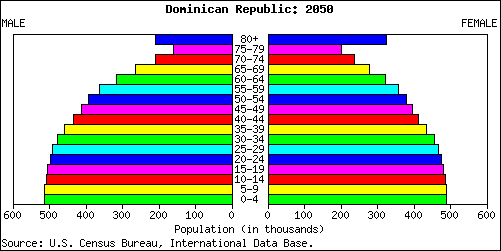
 -compared to the past age structure, the current age structure is becoming more rounded between all the ages instead of having a bigger population between the ages 0-34 years old and the elder people having a longer life expectancy than in 1990


1990's Structure:
 -the past age structure of 1990 had a smaller population in the elder people and a larger population in the younger people because of the high death rates and having a shorter life expectancy in 1990's


2050's Structure:
 -the future age structure of 2050 is predicted to be well rounded among all the ages with elder people having a smaller population because of slightly higher death rates however still a bigger population than the 1990 structure because of a much longer life expectancy


Sustainability of Population: 
 -the current growth and size is not sustainable
           -with a large population there is not enough food or water for all the people
           -there are not enough jobs and since many people are moving to coastal cities there is limited space

Diseases:
 -food or water born diseases: bacterial diarrhea, hepatitis A, typhoid fever
 -water contact disease: leptospirosis

Hunger:
 -21% of population suffering from hunger
           -2,147,351 suffering from hunger


Strategies to Sustain the Population:
-implementing better family planning programs
-transfer money to improve health care systems
-get a stricter immigration policy
-work to create water treatment plants
-work to create proper sewage disposal

Recommendations: 
-create incentives for kids to stay in school longer to help keep the growth rate down
-continue to implement family planning policies
-incentives for families with less children (ex. cash benefits)